


The Influence of Climatic Change on the Late Bronze Age Collapse and the Greek Dark Ages
Drake, B.L.
2012 The Influence of Climatic Change on the Late Bronze Age Collapse and the Greek Dark Ages, Journal of Archaeological Science 39: 1862 - 1870
Drake, B.L.
2012 The Influence of Climatic Change on the Late Bronze Age Collapse and the Greek Dark Ages, Journal of Archaeological Science 39: 1862 - 1870
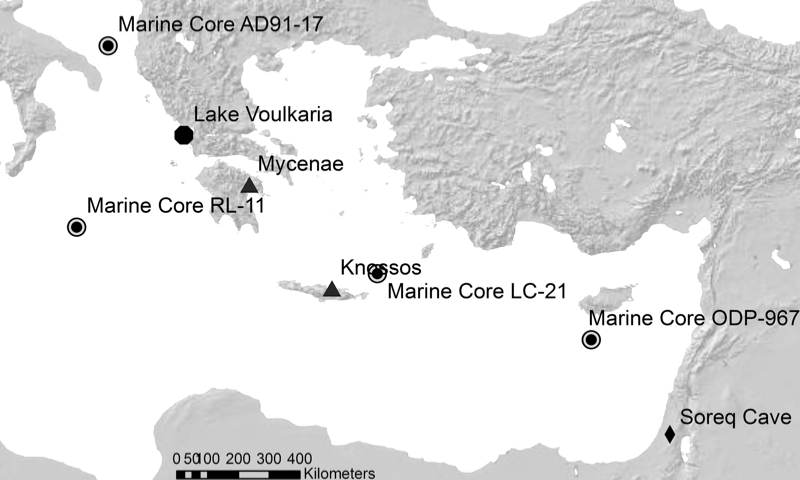
Over the course of 2011, I researched data on the Late Bronze Age Collapse. About 3,000 years ago (~1,200 BC) urban centers across the Eastern Mediterranean were burned down and abandoned. This included cities in Greece, Israel, Turkey, and even parts of Egypt. The causes of this collapse have remained somewhat mysterious. For centuries afterward, societies in the region are much less complex. The Egyptian New Kingdom gives way to the third intermediate period. Egypt's territory in modern day Israel and Palestine is invaded. The Hittite Empire collapses and Hittite as a language ceases to be written (and evidently spoken). And in Greece, the 'Dark Ages' begin, with no evidence for writing and limited archaeological visibility.
I suspected that such large changes in social organization required something a bit beyond the contemporary explanation of 'systems collapse.' I looked at paleoclimate indicators, including oxygen-isotope speleothem records, stable carbon isotope data from bulk pollen samples, alkenone-derived sea surface temperatures, and ratios of warm species dinocysts and foraminifera.
I suspected that such large changes in social organization required something a bit beyond the contemporary explanation of 'systems collapse.' I looked at paleoclimate indicators, including oxygen-isotope speleothem records, stable carbon isotope data from bulk pollen samples, alkenone-derived sea surface temperatures, and ratios of warm species dinocysts and foraminifera.

Paleo annual rainfall reconstructed from oxygen isotope speleothem data (top; Bar-Matthews et al. 2003) and 13C discrimination calculated from pollen radiocarbon dates (second line; Jahns 2005). Both records indicate a drop in precipitation beginning near the LBA collapse (a) and continuing through the “Greek Dark Ages”. Both records also indicate a climatic recovery during the Roman Warm Period (b). Occupation of Palatial centers in Greece (third line) and Crete (last line) show a sharp drop near the beginning of the hypothesized arid period. Dark shading around lines represents 95% confidence bands. The LBA collapse, extends from (a) to the final disappearance of recognizable Mycenaean culture before 1000 BCE (From Drake 2012).
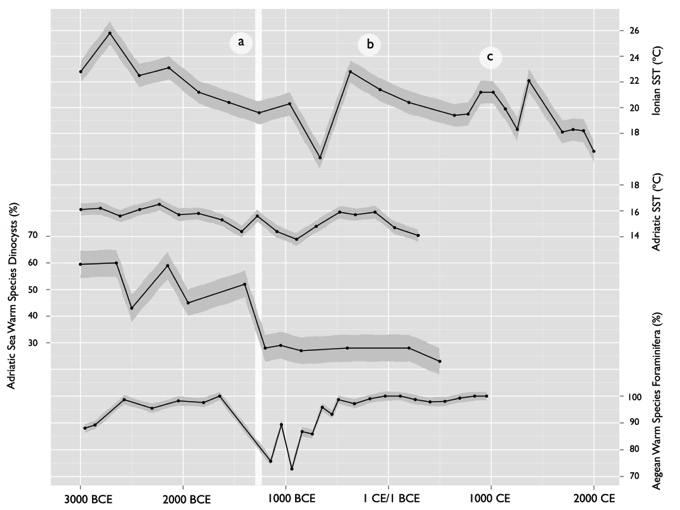
Eastern Mediterranean sea surface temperatures (SST) as indicated by alkenone temperatures and warm-species formanifera. A drop of SST can indicate lower levels of evaporation, which in turn indicate less precipitation. The Ionian Sea (top line; Emeis et al. 2000) dropped by 4 ºC following the LBA Collapse (a). Temperatures returned to their pre-LBA Collapse levels during the Roman Warm Period (b). A drop of 3 ºC during the Medieval Warm Period (c) occurs as well. Adriatic SST (second line; Sangiorni et al. 2003) dropped 1 - 2 ºC after the LBA Collapse (a), however a 25% reduction in Adriatic warm-species dinocysts (third line; Sangiorni et al. 2003) before the LBA Collapse (a) suggests cooling may have been rapid and severe. A similar decline in warm-species formanifera in the Aegean Sea (last line; Rohling et al. 2002) at the same time suggests significantly cooler waters as well. Dark shading around lines represents 95% confidence bands (From Drake 2012).
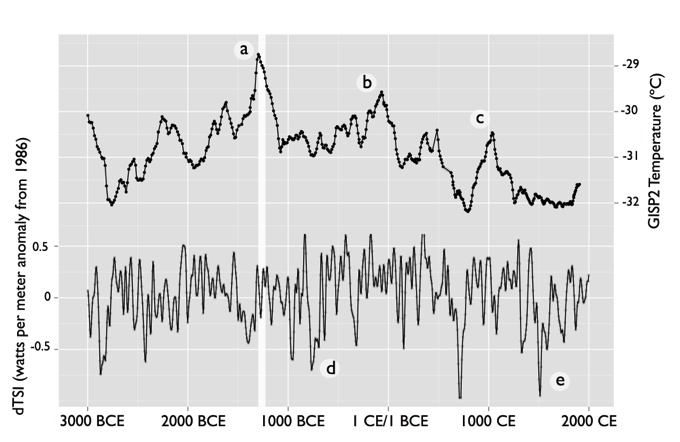
Greenland Ice Sheet Project (GISP2) Temperature (top line; Alley 2004) and a 20-point moving average of Solar Irradiance (bottom line; Steinhilber et al. 2009) for the past 5,000 years. A large increase and sharp decrease in Northern Hemisphere temperatures occurred during the LBA Collapse (a). Similar (albeit smaller) temperature decreases terminated the Roman Warm Period (b) and Medieval Warm Period (c). Low solar irradiance, periods typified by low sunspot activity, are associated with cooler SSTs. Low solar irradiance occurred during the Greek Dark Ages (d), potentially contributing to continued low SSTs. This period of low solar irradiance is comparable to the more well known Maunder Minimum (e) (Drake 2012).
Overall, it seems that a drop in sea surface temperatures may have suppressed evaporation, which in turn suppressed rainfall. This state of affairs may have contributed to the aridity observed in land-based records. You can read the paper through the Journal of Archaeological Science or my Academia.edu page. You can also download the R code to run the analysis yourself.